By Morf Morford
Tacoma Daily Index
Where can you afford to live? Where would you prefer to live?
The Economic Policy Institute released an updated cost of living calculator which contains data on the cost of living for ten family types (four children as maximum family size) in all 3,142 counties (and county equivalents) and in all 611 metro areas across the United States.
The Family Budget Calculator takes into account general regional differences in cost of living and factors in a broad range of basic expenses—including housing, food, transportation, child care, health care, and other necessities.
To keep the budgets relatively realistic, the calculator does not include many common expenses associated with a middle-class lifestyle, such as paying off student loans or saving for college or retirement.
To put it mildly, the Family Budget Calculator is a stark reminder that many workers in low-wage jobs do not earn enough to meet their family’s basic needs. Even after adjusting for higher state and city minimum wages, there is nowhere in the country where a minimum-wage worker—even a single adult without children—earns enough to meet the requirements of their local family budget.
It would be easy to make the argument that raising the average workers pay is not a political or even moral issue (though it certainly is both of those) but is instead a purely mathematical problem. It literally does not add up that an individual – or even a couple – can work full time and not be able to afford to provide shelter, food and other basics for themselves.
Policy and lawmakers should draw on tools like this to get a sense of how realistic the correlation between wage and budget are. You can see how standard your budget is and where you can afford to live here – https://www.epi.org/resources/budget/.
I work with a lot of young people who are renters. The rents as part of this formula seem unreasonably low to me. I can’t imagine rent or a monthly mortgage payment anywhere near this – something like double that amount seem closer to reality – at least in the greater Tacoma area.
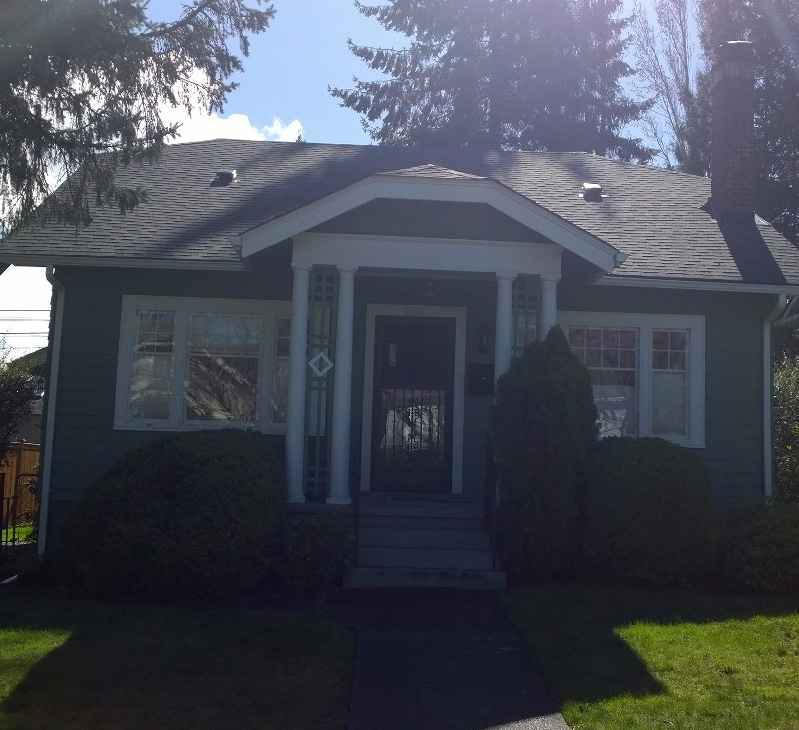
As a personal point of reference, I bought my first house in a modest North End neighborhood in 1985 for $50,000. It sold in the summer of 2017 for over $350,000.
That’s a seven-fold increase. No one I know got paid seven times more in 2017 as they made in 1985.
The cost of living has gone up dramatically – especially housing, while pay has clearly not kept up.
My daughter just bought her first house in spring of 2018. It is in the same neighborhood as our first house – but about 30 years later. Her monthly property tax is almost exactly the same as our 1985 house payment.
If you add in student loans, credit card debt, car payments, any unexpected expenses, medical bills or children, it’s astounding that any young families can afford a home around here.


Photo: Morf Morford
We all know living expenses are high in the Tacoma area – but not as high as Seattle-King County.
I used the Family Budget Calculator to compare a basic budget for a couple with no children living in Tacoma and Seattle.
Monthly cost of living in Tacoma-Pierce County according to the Family Budget Calculator
2 Adults And No Children – Tacoma Metro Area
Housing $881
Food $496
Transportation $1,051
Health Care $564
Other Necessities $556
Taxes $506
Monthly Total $4,054
Annual Total $48,652
As you can see, the annual cost of living in Seattle is almost eight thousand dollars a year more than in Tacoma-Pierce County.
That’s the budget for almost two full months.
Monthly cost of living in Seattle-King County according to the Family Budget Calculator
2 Adults And No Children- Seattle/Bellevue Metro Area
Housing $1,243
Food $542
Transportation $1,021
Health Care $559
Other Necessities $720
Taxes $633
Monthly Total $4,719
Annual Total $56,630
I thought I’d also compare the cost of living in Tacoma with the cost of living in Spokane. Spokane and Tacoma are extremely close in population. Spokane (http://worldpopulationreview.com/us-cities/spokane-population/) has only a couple thousand more citizens than Tacoma, but Tacoma (http://worldpopulationreview.com/us-cities/tacoma-population/) is growing far more quickly.
Tacoma is also far more racially diverse (Tacoma is about 65% white while Spokane is about 87% white).
About 16% of Tacoma residents live below the federal poverty line.
Monthly cost of living in Spokane metro area according to the Family Budget Calculator
2 Adults And No Children – Spokane Metro Area
Housing $609
Food $475
Transportation $988
Health Care $532
Other Necessities $437
Taxes $393
Monthly Total $3,435
Annual Total $41,221
Tacoma is of course, much closer to Seattle.
The closest major city to Spokane is also Seattle – but it is 279 miles away. Spokane is twenty miles from the border with Idaho.
In other words, Spokane is the regional urban center, while Tacoma is one of many small to mid-sized cities surrounding Seattle.
Spokane costs about $7,400 less per year than Tacoma.
I’m not an economist, but I am always puzzled by the difference in the cost of living in certain areas. Why, for example, would the cost of living be so much less in Spokane than Tacoma?
Wouldn’t you think that the economies of scale would dictate that the larger customer base of the Puget Sound area would make life more affordable here?
Quality of life is not always quantifiable, but the Washington State Department of Health recently released a survey of county heath (http://www.countyhealthrankings.org/app/washington/2018/rankings/outcomes/overall).
The cost of living and the quality of life intersect, but not always in predictable ways.
Life in these three regions is different in more ways than most of us would ever imagine.
A few highlights are; King County ranks highest in length of life, 12th (of 39 counties) in teen birth rate, with 9% of adults as smokers and a 22% obesity rate. Spokane County ranks 26 in length of life, 22 in teen births, 16% of adults smoke and 29% are obese.
Pierce County ranks 21st in length of life, 24th in teen births, with 15% adult smokers, and a 31% obesity rate.
When it comes to violent crime, Pierce County leads the way – but not by much (http://www.countyhealthrankings.org/app/washington/2018/measure/factors/43/map).
We make our choices, we adapt or make do.
Every county or metro area has its more – or less – appealing areas.
We might find ourselves or be born in a certain area, or make a deliberate decision, but either way, we make our home somewhere.


