By Morf Morford
Tacoma Daily Index
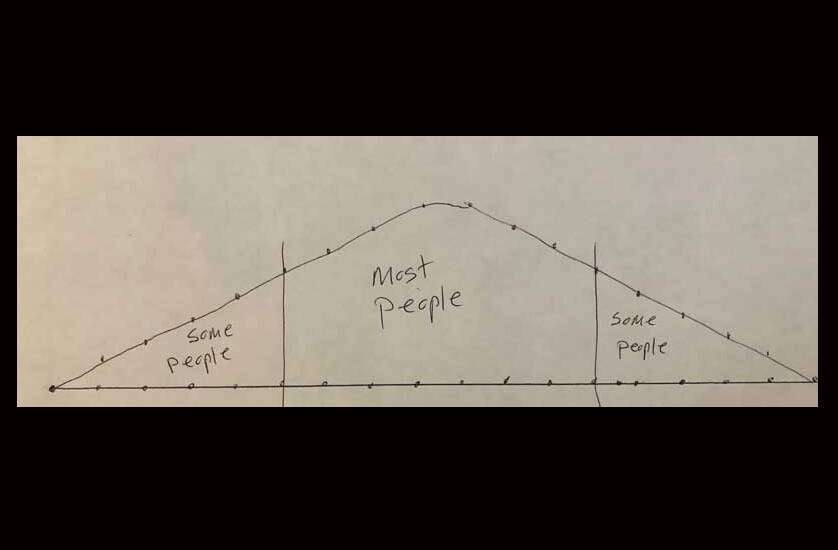
Remember the Bell Curve? For many years it was a model for how almost everything worked.
The Bell Curve was used to describe the mathematical concept called normal distribution, sometimes referred to as Gaussian distribution.
“Bell curve” refers to the bell shape that is created when a line is plotted using the data points for an item that meets the criteria of standard, largely predictable development and distribution. The premise is simple, the curve is concentrated and most prominent in the center and decreases on either side. This is significant in that the data has less of a tendency to produce unusually extreme values, called outliers.
In even simpler terms, the numbers begin low, gradually build to a peak and then decline, essentially to the beginning point or level.
The bell curve model presumes that the data is, or will be, symmetrical. This means that you can create reasonable expectations as to the possibility that an outcome will lie within a range to the left or right of the center.
The bell curve is useful when it comes to probability distributions, which is just a two-dollar term for predictable rise and decline of almost everything.
Consider the sales of any once “hot” item from Beanie babies to compact discs to Fidget Spinners.
Sales were essentially non-existent, rose to a peak and then returned to near non-existence.
Or consider something as basic as driving a vehicle. The vehicle is stationary, starts, gains speed, achieves top speed, arrives at its destination and then becomes stationary again.
This basic structure applies to seasons and forces of nature as well. From gradual temperature changes over the course of a day to one’s energy and activity level as the day progresses, we see this pattern on regular basis in our daily lives. And, of course, in large scale markets and economies.
Any given product meets its level of market saturation and then levels off.
A healthy, stable and sustainable economy will hold about 70-80% of its participants close to the middle with only 1-2% at the “outlier” margins.
But, as with everything else it seems, that was then and this is now.
The bulk of our economy for the past several decades (from the 1950s to the early 1980s) was based on a solid and stable middle-class. These are the people who buy homes, send their kids to college, have predictable, perhaps even ample incomes – and time to travel and vacation.
Their “disposable” income kept the economy going.
Laws and policies, from zoning to income tax and mortgage rates, were geared to the health and stability of this “class”.
The Missing Middle
In housing there is a common term – the “missing middle”. For whatever set of reasons, we have emphasized, in terms of new construction, large (even massive) housing units or individual single-family homes and neglected the mid-range developments of between approximately 4-20 units.
When it comes to the social class structure in America we have emphasized the same bifurcation; in the past 10-15 years we have seen a dramatic increase in millionaires – even billionaires and a corollary growth in the number of poor, displaced, even homeless citizens. And, of course, an equally dramatic drop in the numbers (and influence) of our middle class.
We lionize our billionaires, from Jeff Bezos to Elon Musk, demonize our poor and homeless and price the middle class out of their own neighborhoods.
And we keep doing things that exacerbate even further these class distinctions.
Our private schools and homeless camps have become more extreme, more isolated and more symptomatic of outliers, every year.
Vanity space shots and urban homeless camps in every city center have become the signifying “outlier” benchmarks of our economy.
As I mentioned above, a healthy, stable and sustainable economy has a place for about 70-80% of its participants close to the middle with only 1-2% at the “outlier” margins.
With interest rates climbing, and housing prices growing by the day (a friend of mine posted online that his home value had gone up $10,000 a month over the previous year) the economic “winners” and “losers” become ever more clear – and numerous.
That $10,000 monthly increase in equity is a $10,000 financial obstacle to any potential buyer.
But an obvious question emerges – is this any way to run an economy?
The answer of course is, it depends what kind of economy you want to run. And for how long.
The more durable economy, like any building, will be the one with the most solid foundation. In all too obvious contrast, the weakest and most unstable will be the economy (or building) with the weakest base.