We have two months of new Washington employment data since the June forecast was released. Total nonfarm payroll employment rose 18,100 (seasonally adjusted) in June and July, which was 6,300 more than the 11,800 expected in the June forecast.
Washington variance in employment growth was mostly due to the private services-providing sectors, which added 15,300 jobs compared to 9,400 in the June forecast. Manufacturing employment increased 1,700 in June and July boosted by an increase of 1,300 aerospace employees. Construction employment decreased by 500 jobs while government payrolls expanded by 1,600 jobs.
Washington housing construction declined in the second quarter of 2018 and fell short of the June forecast. The number of housing units authorized by building permits decreased to 43,200 units (SAAR) in the second quarter of 2018 from 49,200 units in the first quarter. Second quarter permits were made up of 23,000 single-family units and 20,200 multi-family units. The June forecast assumed 46,700 units (SAAR) in the second quarter, consisting of 24,400 single-family units and 22,300 multi-family units.


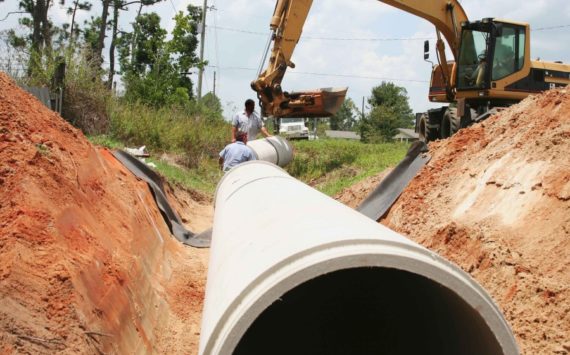
Photo: Morf Morford
Seattle area home prices continue to rise very rapidly. According to the S&P/CaseShiller Home Price Indices, seasonally adjusted Seattle area home prices rose 1.4% in May compared to a 0.2% increase in the Composite20 index. Over-the-year prices are up 13.6%, more than double the 6.5% increase in the Composite-20 index. Seattle home prices are up 91% since the December 2011 trough and now exceed the May 2007 peak by 33%.
Seattle area consumer price inflation remains well above the national average. Over the last year, from June 2017 to June 2018, consumer prices in the Seattle area rose 3.3% compared to 2.8% for the U.S. city average. Core prices, which exclude food and energy, were up 2.9% in Seattle compared to 2.2% for the nation. The higher Seattle inflation is due to more rapid growth in shelter costs. During the year, shelter costs in Seattle rose 6.4% compared to 3.4% for the nation. Excluding shelter costs, Seattle inflation was below the national average at 1.5% compared to 2.5%.
Despite a decline in transportation equipment, Washington exports were up over the year for a third consecutive quarter. Exports increased 3.7% in the second quarter of 2018 compared to the second quarter of 2017. Transportation equipment exports (mostly Boeing planes) declined 5.3% over the year but exports of agricultural products rose 26.8% and exports of all other commodities (mostly manufacturing) increased 12.0%.
The Institute of Supply Management – Western Washington Index (ISM-WW) increased in July and remained solidly in positive territory. The index, which measures conditions in the manufacturing sector, increased from 56.0 in June to 60.0 in July (index values above 50 indicate growth while values below 50 indicate contraction). The index has exceeded 50 in each of the last 12 months. The production, orders, employment, and inventory components all indicated expansion in July while the deliveries component was neutral at 50.
Car and truck sales appear to have plateaued. Seasonally adjusted new vehicle registrations fell 1.4% in July but are up 0.9% over the year. Car and truck sales are down 13.1% since the post-recession peak in November 2017.Car and truck sales appear to have plateaued. Seasonally adjusted new vehicle registrations fell 1.4% in July but are up 0.9% over the year. Car and truck sales are down 13.1% since the post-recession peak in November 2017.
– Economic and Revenue Forecast Council


