In the third quarter of 2019, African American workers had the highest unemployment rate nationally, at 6.0%, followed by Hispanic workers (at 4.1%), white workers (at 3.1%) and Asian workers (at 2.6%). This report provides a state-by-state breakdown of unemployment rates by race and ethnicity and racial/ethnic unemployment rate gaps for the third quarter of 2019. More details can be found here: https://www.epi.org/indicators/state-unemployment-race-ethnicity/.

2019 Q3 • Updated November 2019
Latest data: Black, Hispanic, Asian, and white unemployment rates are at or below pre-recession levels in majority of states
Between the first and third quarters of 2019, employment prospects for black workers improved in the majority of states for which data are available. While the gap between the black and white unemployment rates narrowed in half of the states for which data are available, black unemployment remains high relative to that of other workers throughout the United States. Following are some key highlights of the report:
The African American unemployment rate is at or below its pre-recession level in 20 states (these data are available for 21 states and the District of Columbia). However, in 12 states and in the District of Columbia, African American unemployment rates exceed white unemployment rates by a ratio of 2.0-to-1 or higher.
The District of Columbia has a black–white unemployment rate ratio of 6.1-to-1, while Mississippi and Illinois have the highest ratios among states (3.5-to-1 and 3.0-to-1, respectively).
The highest African American unemployment rate is in the District of Columbia (11.3%), followed by Illinois (9.6%), Mississippi (9.5%), Michigan (8.1%), and New York (7.3%). The highest Hispanic state unemployment rate is in Arizona (5.9%), followed by Louisiana (5.8%), New Mexico (5.8%), Oregon (5.0%), and North Carolina (5.0%). Meanwhile, the highest white state unemployment rate is 4.5%, in Washington and West Virginia.
The Hispanic unemployment rate is at or below its pre-recession level in 14 states (of the 16 states for which these data are available). The Hispanic unemployment rate is lower than the white rate in one state (Nevada, 0.8-to-1).
The largest gaps between Hispanic and white unemployment rates are in Louisiana (2.0-to-1) and in Texas and Virginia (1.8-to-1 each).
Background
In September 2019, the national unemployment rate was 3.5%, down from 3.8% at the end of the first quarter (March) of 2019. State unemployment rates in September ranged from a low of 2.2% in Vermont to 6.2% in Alaska. According to a previous EPI analysis of unemployment by state, from March 2019 to September 2019, 32 states and the District of Columbia saw their unemployment rates decline, 14 states saw unemployment rates rise, and four states saw no change.
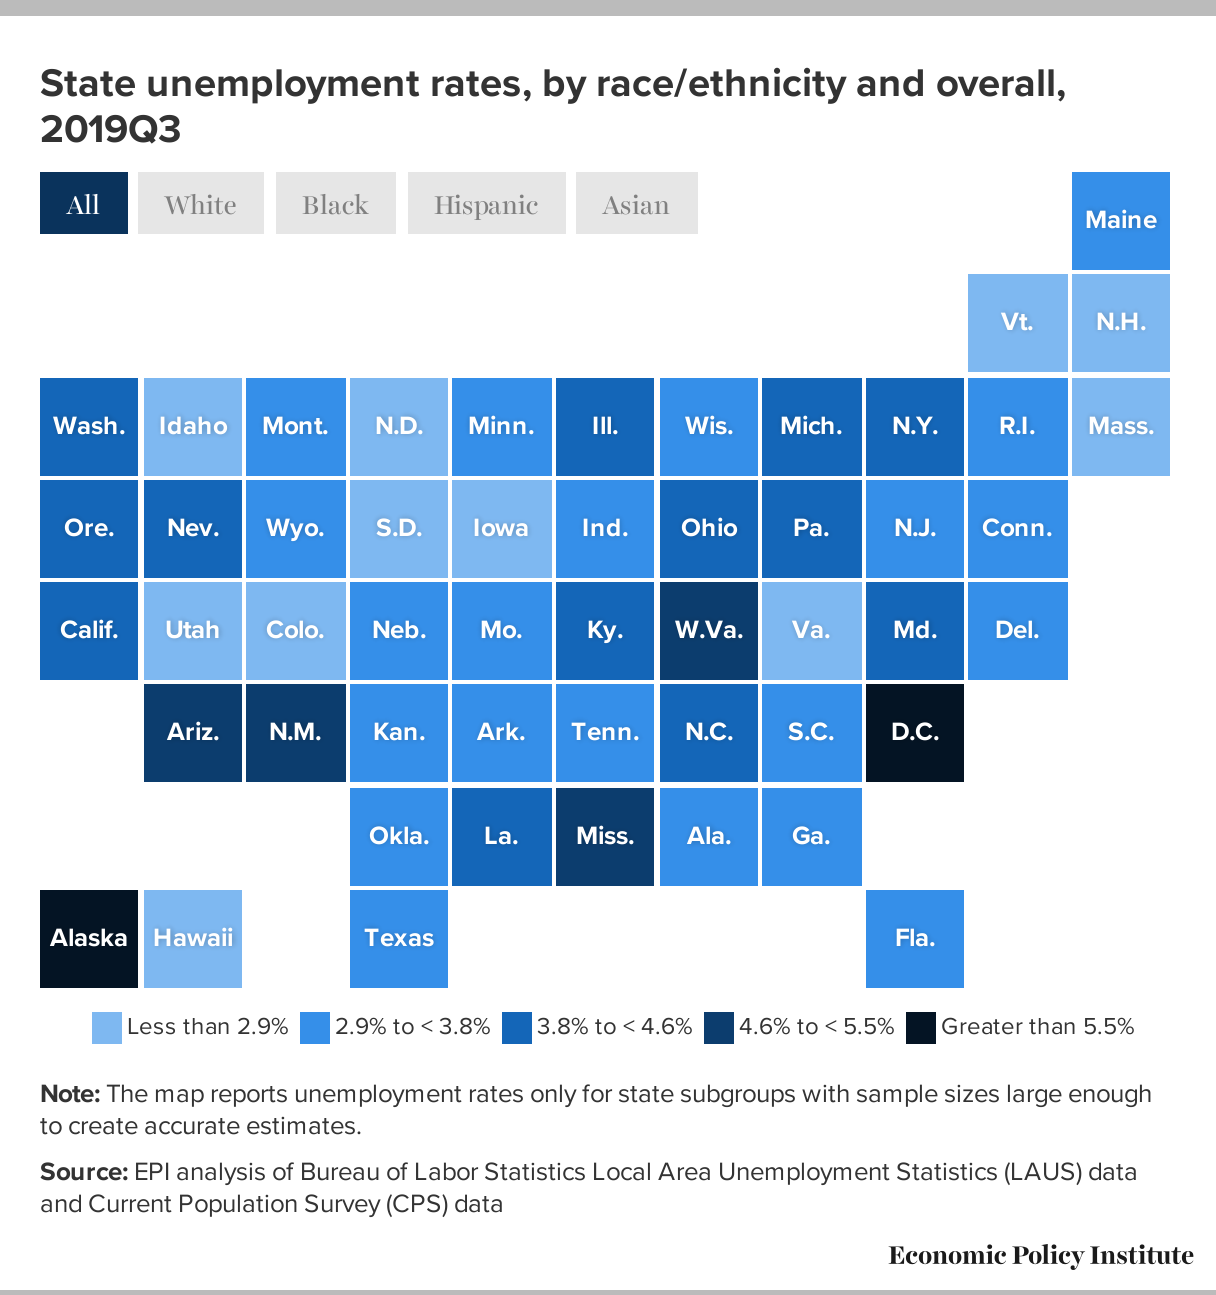
State unemployment rates, by race and ethnicity
EPI analyzes state unemployment rates by race and ethnicity, and racial/ethnic unemployment rate gaps, on a quarterly basis to generate a sample size large enough to create reliable estimates of unemployment rates by race and ethnicity at the state level. We report estimates only for states for which the sample size of these subgroups is large enough to create an accurate estimate. For this reason, the number of states included in our map and data tables varies based on the analysis performed (unemployment rate, change in unemployment rate since the fourth quarter of 2007, and ratio of African American or Hispanic unemployment rate to white unemployment rate).

Trends among white workers
In the third quarter of 2019, the white unemployment rate was lowest in South Dakota and the District of Columbia (both 1.9%) and highest in Washington and West Virginia (both 4.5%), as shown in the interactive map and underlying data table, which present state unemployment rates by race and ethnicity.
Table 1 displays changes in state unemployment rates by race and ethnicity from the fourth quarter of 2007—the last quarter before the Great Recession—to the third quarter of 2019. The white unemployment rate remained most elevated above its pre-recession level in Wyoming (0.8 percentage points higher) and in Arizona and Maryland, both at 0.7 percentage points higher than in the fourth quarter of 2007. The white unemployment rate is at or below its pre-recession level in 43 states. The largest declines in white unemployment since the end of 2007 have occurred in Michigan (down 2.3 percentage points), Vermont (down 2.2 percentage points), Rhode Island (down 2.2 percentage points), and Maine (down 2.0 percentage points). The white unemployment rate is above but within 0.5 percentage points of its pre-recession level in the District of Columbia, Louisiana, New Mexico, North Dakota, and Utah.