America’s face is changing
Published 1:30 am Wednesday, September 22, 2021
By Morf Morford
Tacoma Daily Index
2050 is closer to us than 1990.
America is changing.
To be more specific, America has always been changing.
Here’s an excerpt from the US Census regarding how we, as a nation are expected to change from 2014 to 2060;
Between 2014 and 2060, the U.S. population is projected to increase from 319 million to 417 million, reaching 400 million in 2051. The U.S. population is projected to grow more slowly in future decades than in the recent past, as these projections assume that fertility rates will continue to decline and that there will be a modest decline in the overall rate of net international migration. By 2030, one in five Americans is projected to be 65 and over; by 2044, more than half of all Americans are projected to belong to a minority group (any group other than non-Hispanic White alone); and by 2060, nearly one in five of the nation’s total population is projected to be foreign born. (https://www.census.gov/library/publications/2015/demo/p25-1143.html)
By age, by race, and even by numbers, America is changing. Every community, vocational field, school, election and neighborhood in America looks little like it did even a few years ago.
We are changing deeply and rapidly. And, according to most of those who study demographics, we are changing permanently.
Here’s an excerpt from a census data page projecting population change between 2020 and 2060:
The year 2030 marks a demographic turning point for the United States. Beginning that year, all baby boomers will be older than 65 years of age. This will expand the size of the older population so that one in every five Americans is projected to be of retirement age. Later that decade, by 2034, we project that older adults will outnumber children for the first time in U.S. history. The year 2030 marks another demographic first for the United States. That year, because of population aging, immigration is projected to overtake natural increase (the excess of births over deaths) as the primary driver of population growth for the country.
Beyond 2030, the U.S. population is projected to grow slowly, age considerably, and become more racially and ethnically diverse.
Despite slowing population growth, particularly after 2030, the U.S. population is still expected to grow by 79 million people by 2060, crossing the 400 million threshold in 2058. (https://www.census.gov/library/publications/2020/demo/p25-1144.html)
These demographic shifts resonate, shake and even shatter many long held traditions and expectations.
Some regions and states are affected in different ways – and of course, are reacting in different ways.
Arizona, for example, has, for many years, been known as the state of “old white people and young Hispanic people”. As time goes by, the obvious becomes undeniable; “old white people” don’t live forever and “young Hispanic people” don’t stay young forever.
The ever-growing Hispanic population in Arizona (and Texas) will, like every numerically dominant population, push, bulge and tilt the larger culture and, like the boomer generation before it, to a large degree, remake the culture in its own image.
Change is never easy. Near total, national demographics shifts on a scale like we are experiencing is near traumatic.
These are once in a nations’ life time shifts.
A former work colleague of mine describes this as “white replacement theory”.
He, a fan of anti-vax, one-world globalist, chem-trails conspiracies, sees this demographic shift as a deliberate centralized elitist government plan to depopulate the earth, claim all of the earth’s resources and enslave the masses who will work forever on their behalf.
Those conspiracy theories might activate our imaginations, or even inflame our biases, but these demographic trends have been visible for years – even a few decades.
Consider the size of the standard middle family – and home. Before World War II for example, typical family size was six to eight children. The post-war Boomer generation, in most cases, held two to four children. The following generation had one or two children. In the 2020s, among those in the middle class (or higher) a family of four children is considered large.
Demographers have noticed an unexpected trend; those with a higher income have fewer children and those with lower incomes tend to have more children.
Over time, and across the country, (and, to a large degree, around the world) these distinctions become even more stark; wealthy countries are declining in population while poorer nations are increasing in population.
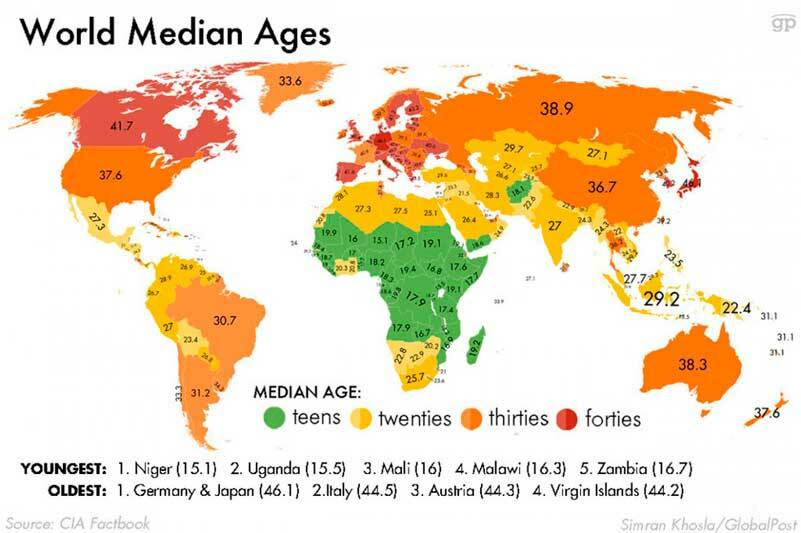
In other words, the earth is much like Arizona – with an aging (and declining) white population and a rapidly increasing non-white population. You can see a breakdown of individual nations (as of 2020) here: https://www.cia.gov/the-world-factbook/field/median-age/.
Some aspects of this research makes sense; Afghanistan’s median age for males is 19 and a half, while Belgium, Denmark and Canada’s median age for men is slightly over 40. In Chad (and much of Africa) the median age is in the mid-teens. In the USA, the median male is 37 while the median female is 39.8.
World wide, the median male is 30 while the median female is 31.8.
You don’t need to be a mathematical genius, or a flat-earth conspiracy theorist to see where this is going. Europeans in their forties are not likely to have very many more children while Africans in their twenties are.
These changes will up-end elections, the professions, popular culture, the arts and music.
For a sense of how population has changed since 1950 and how it is expected to change until 2100, take a look at this sliding-scale map from the United Nations Population Division: https://www.cia.gov/the-world-factbook/field/median-age/.
As I mentioned, these changes have been a long time coming. I’ve been talking about them in my classes for about ten years. The ratio of white to non-white population has been declining by about 2% per year for a couple decades now.
It’s not a conspiracy, it’s just basic math.